あい
今回はR言語を
利用して1標本の
母集団に関する
x^2検定と推定を
行うプログラムを
実装します
R]※本サイトにはプロモーションが含まれています
R言語とは?
R言語は、統計解析やデータ可視化のために
設計されたプログラミング言語および環境です
Rは、様々な統計手法
をサポートしています

あい
早速検定を
やっていきましょ~
カイの二乗検定例題
例題
ある工場で精密機械の部品加工を行っていました。
この機械の寸法精度(分散)は\(0.05^2\)である
機械の部品を入れ替えたとき寸法精度が
変化しているか調べよ
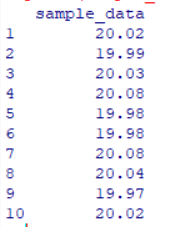
| 1 | 2 | 3 | 4 | 5 | 6 | 7 | 8 | 9 | 10 |
| 20.02 | 19.99 | 20.03 | 20.08 | 19.98 | 19.98 | 20.08 | 20.04 | 19.97 | 20.02 |
カイの二乗検定を実装する
帰無仮説\(H_0 : σ^2 = σ_0\)の
両側検定を行っていきます。
データをcsvに格納します

# データの読み込み
sample_data <- read.csv("sample_data.csv")
# データを確認する
print(sample_data)
検定の計算を行うためにベクトル変換します
# ベクトルに変換
sample_data <- sample_data[[1]]
print(sample_data)帰無仮説の母分散\(σ^2=0.05^2\)
有意水準\(α = 0.05\)
# 検定の設定
sigma_squared_0 <- 0.0025  # 仮定の母分散
alpha <- 0.05  # 有意水準
n <- length(sample_data) # サンプルサイズ
統計量\(x^2\)の計算をする
# 標本分散の計算
sample_variance <- var(sample_data)

# 統計量カイ二乗の計算
chi_squared_statistic <- (n - 1) * sample_variance / sigma_squared_0
検定を行うコードを実装する
# 臨界値の計算
critical_value_lower <- qchisq(alpha / 2, df = n - 1)
critical_value_upper <- qchisq(1 - alpha / 2, df = n - 1)

if (chi_squared_statistic < critical_value_lower || chi_squared_statistic > critical_value_upper) {
  result <- "帰無仮説を棄却する"
} else {
  result <- "帰無仮説を棄却できない"
}

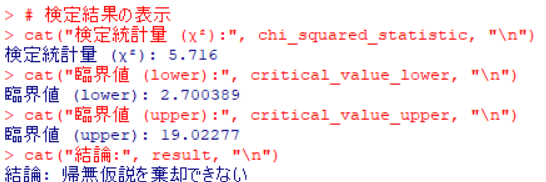
# 検定結果の表示
cat("検定統計量 (χ²):", chi_squared_statistic, "\n")
cat("臨界値 (lower):", critical_value_lower, "\n")
cat("臨界値 (upper):", critical_value_upper, "\n")
cat("結論:", result, "\n")
完成しました!
纏めると
# データの読み込み
sample_data <- read.csv("sample_data.csv")
# データを確認する
print(sample_data)

# ベクトルに変換
sample_data <- sample_data[[1]]
print(sample_data)

# 検定の設定
sigma_squared_0 <- 0.0025  # 仮定の母分散
alpha <- 0.05  # 有意水準
n <- length(sample_data) # サンプルサイズ

# 標本分散の計算
sample_variance <- var(sample_data)

# 統計量カイ二乗の計算
chi_squared_statistic <- (n - 1) * sample_variance / sigma_squared_0

# 臨界値の計算
critical_value_lower <- qchisq(alpha / 2, df = n - 1)
critical_value_upper <- qchisq(1 - alpha / 2, df = n - 1)

if (chi_squared_statistic < critical_value_lower || chi_squared_statistic > critical_value_upper) {
  result <- "帰無仮説を棄却する"
} else {
  result <- "帰無仮説を棄却できない"
}

# 検定結果の表示
cat("検定統計量 (χ²):", chi_squared_statistic, "\n")
cat("臨界値 (lower):", critical_value_lower, "\n")
cat("臨界値 (upper):", critical_value_upper, "\n")
cat("結論:", result, "\n")
点推定と信頼区間95%の区間推定を行う
下記コードを追加してください
# 点推定
point_estimate <- sample_variance

# 信頼区間の計算
chi_squared_critical_lower <- qchisq(alpha / 2, df = n - 1)
chi_squared_critical_upper <- qchisq(1 - alpha / 2, df = n - 1)
confidence_interval <- c((n - 1) * sample_variance / chi_squared_critical_upper,
                         (n - 1) * sample_variance / chi_squared_critical_lower)

# 点推定と信頼区間の表示
cat("点推定 (標本分散):", point_estimate, "\n")
cat("95%信頼区間: [", confidence_interval[1], ", ", confidence_interval[2], "]\n")


