Yamu
今回はローレンツ曲線を
pythonで実装します
[PR]※本サイトには、プロモーションが含まれています
| 合わせて読みたい | 概要 |
| 【統計基礎】エクセルで学ぶ!ローレンツ曲線・ジニ係数の基礎理論 | エクセルを活用してローレンツ曲線とジニ係数を説明しています |
ローレンツ曲線
ローレンツ曲線は
所得や資産などの分布の不平等を視覚化
するために用いられます。
この曲線の縦軸は
縦軸に所得の累積値
横軸に人口の累積値
をプロットします

ローレンツ曲線は完全平等線から離れるほど不平等であることを示しているため
所得や資産の格差を視覚的に確認できる
今回利用するデータセット
日本、ドイツ、アメリカ、スウェーデン、中国の架空の所得データ
import pandas as pd
import numpy as np

# サンプルデータの作成
data = {
    'Japan': [300, 400, 500, 600, 700, 800, 900, 1000, 1100, 1200],
    'Germany': [320, 420, 520, 620, 720, 820, 920, 1020, 1120, 1220],
    'USA': [350, 450, 550, 650, 750, 850, 950, 1050, 1150, 1250],
    'Sweden': [310, 410, 510, 610, 710, 810, 910, 1010, 1110, 1210],
    'China': [280, 380, 480, 580, 680, 780, 880, 980, 1080, 1180]
}

df = pd.DataFrame(data)
print(df)
実行結果
   Japan  Germany   USA  Sweden  China
0    300      320   350     310    280
1    400      420   450     410    380
2    500      520   550     510    480
3    600      620   650     610    580
4    700      720   750     710    680
5    800      820   850     810    780
6    900      920   950     910    880
7   1000     1020  1050    1010    980
8   1100     1120  1150    1110   1080
9   1200     1220  1250    1210   1180
Yamu
データが入りましたね!
早速ローレンツ曲線を実装します
ローレンツ曲線を実装する
import numpy as np
import matplotlib.pyplot as plt

def lorenz_curve(incomes):
    sorted_incomes = np.sort(incomes)
    cum_incomes = np.cumsum(sorted_incomes)
    lorenz_curve = np.insert(cum_incomes / cum_incomes[-1], 0, 0)
    x = np.linspace(0, 1, len(lorenz_curve))
    return x, lorenz_curve

# サンプルデータ
data = {
    'Japan': [300, 400, 500, 600, 700, 800, 900, 1000, 1100, 1200],
    'Germany': [320, 420, 520, 620, 720, 820, 920, 1020, 1120, 1220],
    'USA': [350, 450, 550, 650, 750, 850, 950, 1050, 1150, 1250],
    'Sweden': [310, 410, 510, 610, 710, 810, 910, 1010, 1110, 1210],
    'China': [280, 380, 480, 580, 680, 780, 880, 980, 1080, 1180]
}

plt.figure(figsize=(10, 6))

for country, income in data.items():
    x, lorenz = lorenz_curve(income)
    plt.plot(x, lorenz, label=country)

# 完全平等線
plt.plot([0, 1], [0, 1], color='black', linestyle='--')

plt.title('Lorenz Curve for Different Countries')
plt.xlabel('Cumulative Share of People')
plt.ylabel('Cumulative Share of Income')
plt.legend()
plt.grid(True)
plt.show()
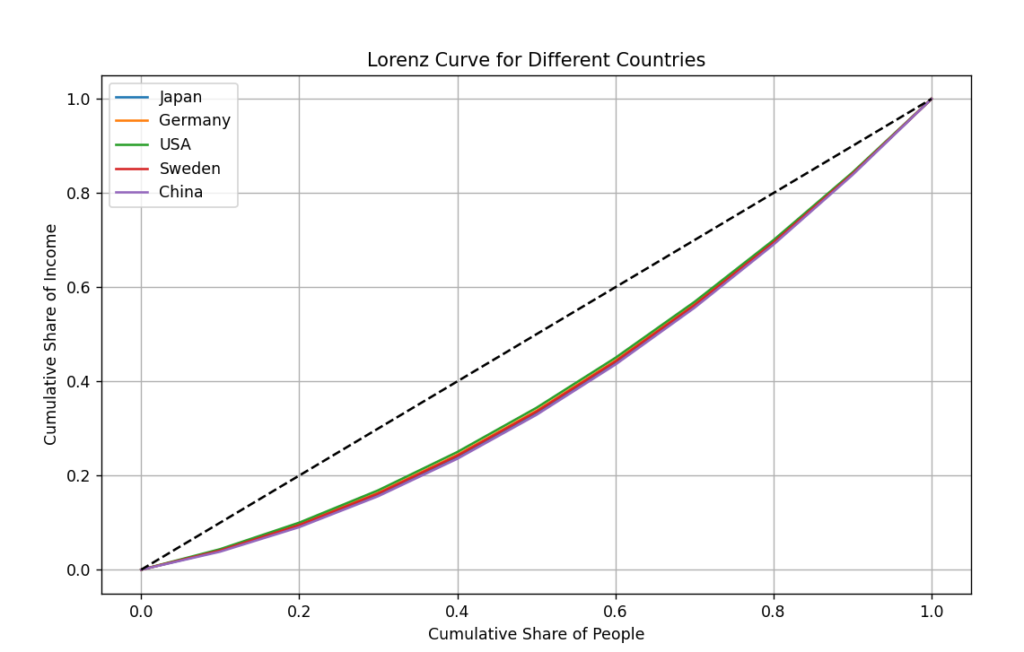
実行結果


Yamu
経済格差を表す
ローレンツ曲線が引けていますね
コードを説明します
ローレンツ曲線のプロットを作成する関数
ローレンツ曲線のプロットを作成する関数
def lorenz_curve(incomes):
    sorted_incomes = np.sort(incomes)
    cum_incomes = np.cumsum(sorted_incomes)
    lorenz_curve = np.insert(cum_incomes / cum_incomes[-1], 0, 0)
    x = np.linspace(0, 1, len(lorenz_curve))
    return x, lorenz_curve
1所得の低い順(昇順)にデータを並べる
sorted_incomes = np.sort(incomes)sorted_incomesの中身
[ 300  400  500  600  700  800  900 1000 1100 1200]
[ 320  420  520  620  720  820  920 1020 1120 1220]
[ 350  450  550  650  750  850  950 1050 1150 1250]
[ 310  410  510  610  710  810  910 1010 1110 1210]
[ 280  380  480  580  680  780  880  980 1080 1180]
2.所得データを累積する
cum_incomes = np.cumsum(sorted_incomes)cum_incomesの中身
[ 300  700 1200 1800 2500 3300 4200 5200 6300 7500]
[ 320  740 1260 1880 2600 3420 4340 5360 6480 7700]
[ 350  800 1350 2000 2750 3600 4550 5600 6750 8000]
[ 310  720 1230 1840 2550 3360 4270 5280 6390 7600]
[ 280 660 1140 1720 2400 3180 4060 5040 6120 7300]3.累積データを全階級の総所得で割る
lorenz_curve = np.insert(cum_incomes / cum_incomes[-1], 0, 0)cum_incomes[-1] は,cum_incomes
の最後の要素つまり総所得
np.insertは配列に値を挿入します
4.xプロットを作成する
x = np.linspace(0, 1, len(lorenz_curve))
return x, lorenz_curveローレンツ曲線に対応するxプロットをnp.linspaceで作成
xとlorenza_curveでyプロットを返しています
lorenz_curve関数で整理したデータからグラフを作成する
lorenz_curve関数で整理したデータからグラフを作成します
plt.figure(figsize=(10, 6))

for country, income in data.items():
    x, lorenz = lorenz_curve(income)
    plt.plot(x, lorenz, label=country)

# 完全平等線
plt.plot([0, 1], [0, 1], color='black', linestyle='--')

plt.title('Lorenz Curve for Different Countries')
plt.xlabel('Cumulative Share of People')
plt.ylabel('Cumulative Share of Income')
plt.legend()
plt.grid(True)
plt.show()
下記コードはループで
データを一つずつ取り出してlorenz_curve関数で
xプロットとyプロットを計算して
plt.plotでグラフを作成しています
for country, income in data.items():
    x, lorenz = lorenz_curve(income)
    plt.plot(x, lorenz, label=country)
最後に完全平等線を引いて
グラフタイトル, ラベル, x軸ラベル, y軸ラベル ,グリット線を
引いて完了です
# 完全平等線
plt.plot([0, 1], [0, 1], color='black', linestyle='--')

plt.title('Lorenz Curve for Different Countries')
plt.xlabel('Cumulative Share of People')
plt.ylabel('Cumulative Share of Income')
plt.legend()
plt.grid(True)
plt.show()
