Yamu
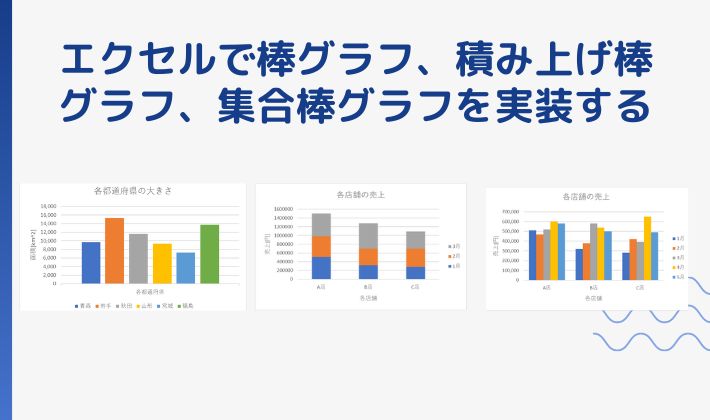
エクセル2019を
利用して
棒グラフ
積み上げ棒グラフ
集合棒グラフを
実装します
[PR]※本サイトには、プロモーションが含まれています
目次
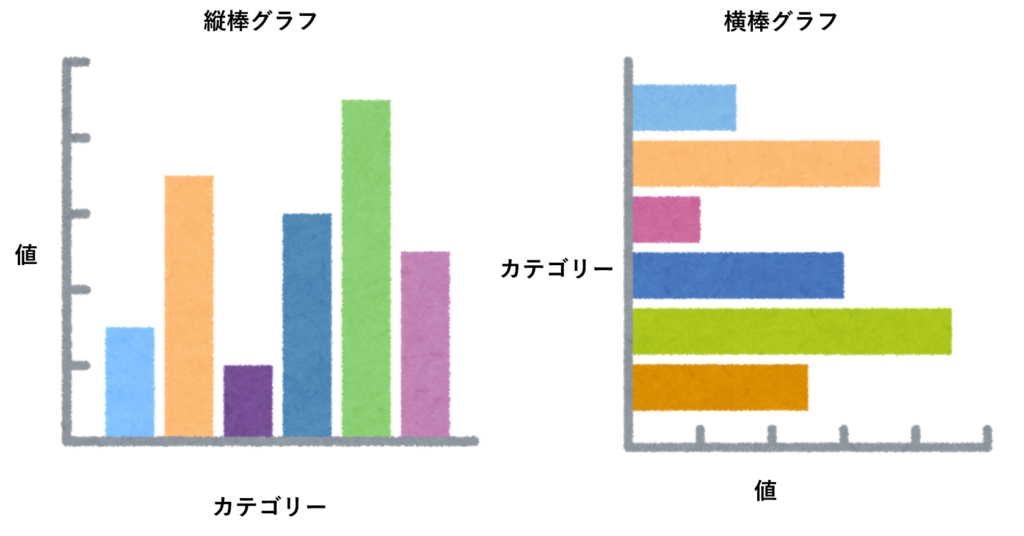
棒グラフとは ?
各カテゴリー数の大きさを
棒で視覚的に表現するためのグラフです
横軸をカテゴリ縦軸を値としたものを
縦棒グラフ
横軸を値とし縦軸をカテゴリとしたものを
横棒グラフといいます
Yamu
各カテゴリーの
値を比較する時に便利です
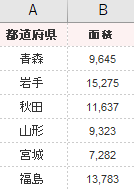
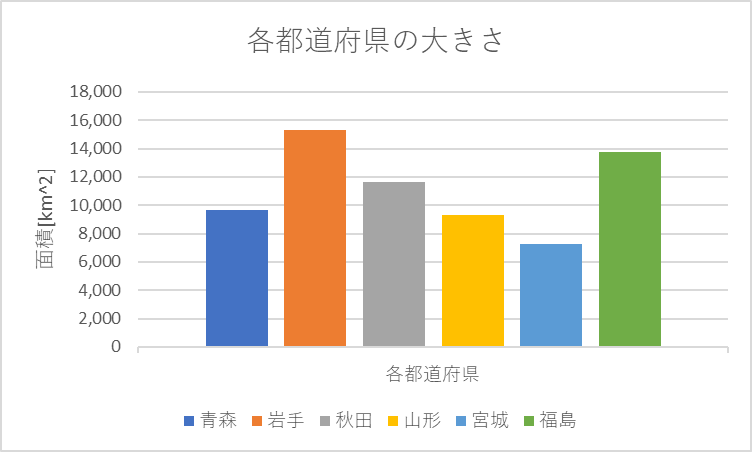
東北地方の県の面積を棒グラフにして可視化する
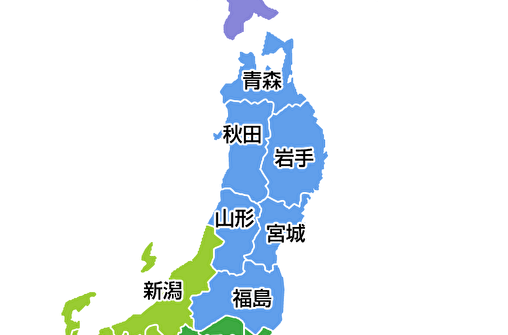
| 都道府県 | 面積\(Km^2\) |
| 青森 | 9,645 |
| 岩手 | 15,275 |
| 秋田 | 11,637 |
| 山形 | 9,323 |
| 宮城 | 7,282 |
| 福島 | 13,783 |
Yamu
各カテゴリーを県
値を棒グラフにします
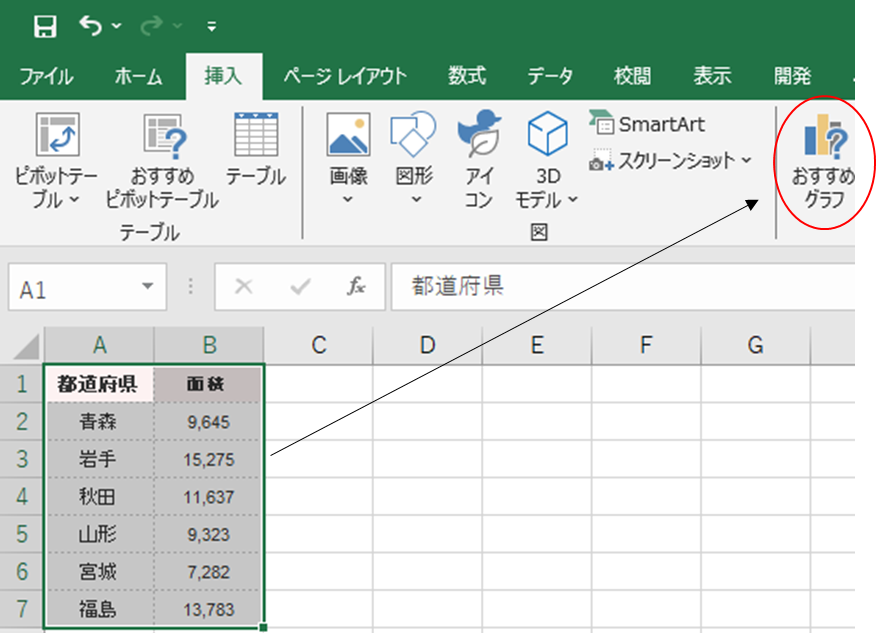
エクセルにデータセットします
左クリックでデータ選択後おススメグラフを押します

おすすめグラフを押す
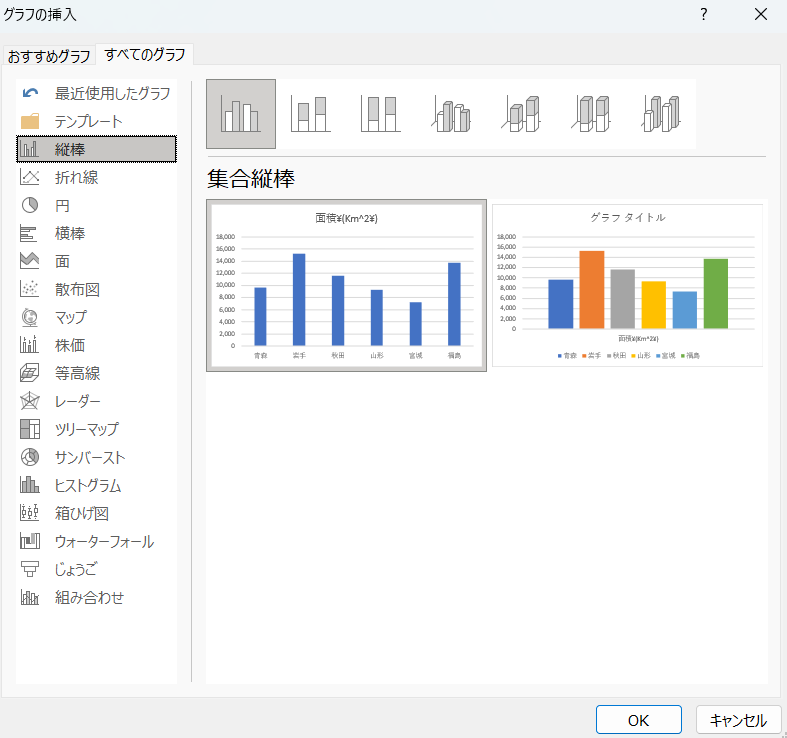
全てのグラフから棒グラフを選択
グラフ要素から軸ラベルを選択し
軸ラベルとタイトルにチェックを入れる
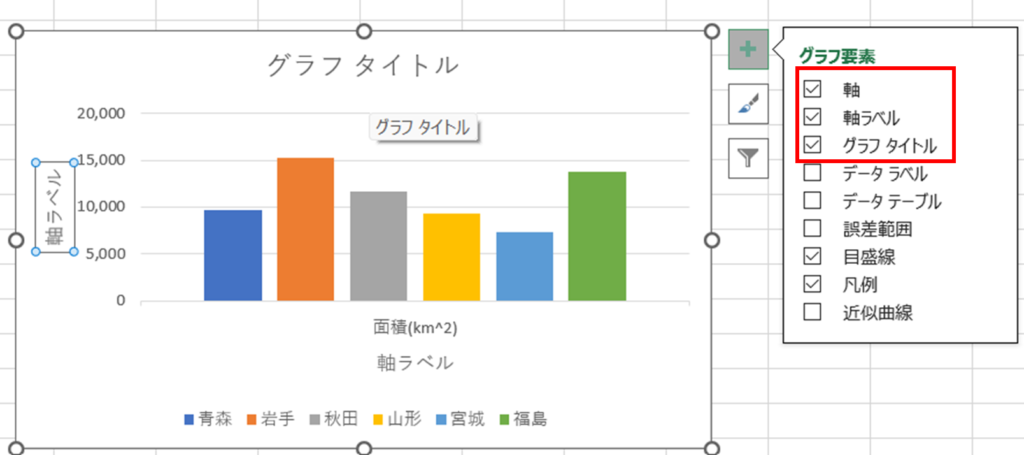
タイトルと軸ラベルを入れて完成
積み上げ棒グラフ
積み上げ棒グラフは
棒グラフを積み上げて表示します
複数のデータを積み上げて全体のデータの合計
を表すことが出来きます
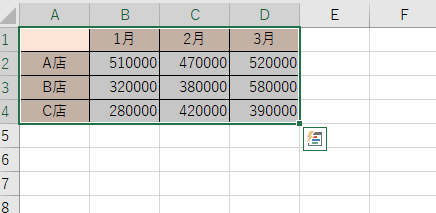
各支店の月ごとの売り上げを積み上げ棒グラフで作成する
各支店1~3月までの
売上データがある
積み上げ棒グラフを作成し
各店舗の売り上げを比較する
| 各支店 | 1月 | 2月 | 3月 |
| A店 | 51,0000 | 47,0000 | 52,0000 |
| B店 | 32,0000 | 38,0000 | 58,0000 |
| C店 | 28,0000 | 42,0000 | 39,0000 |
データをエクセルにセットしデータを選択する
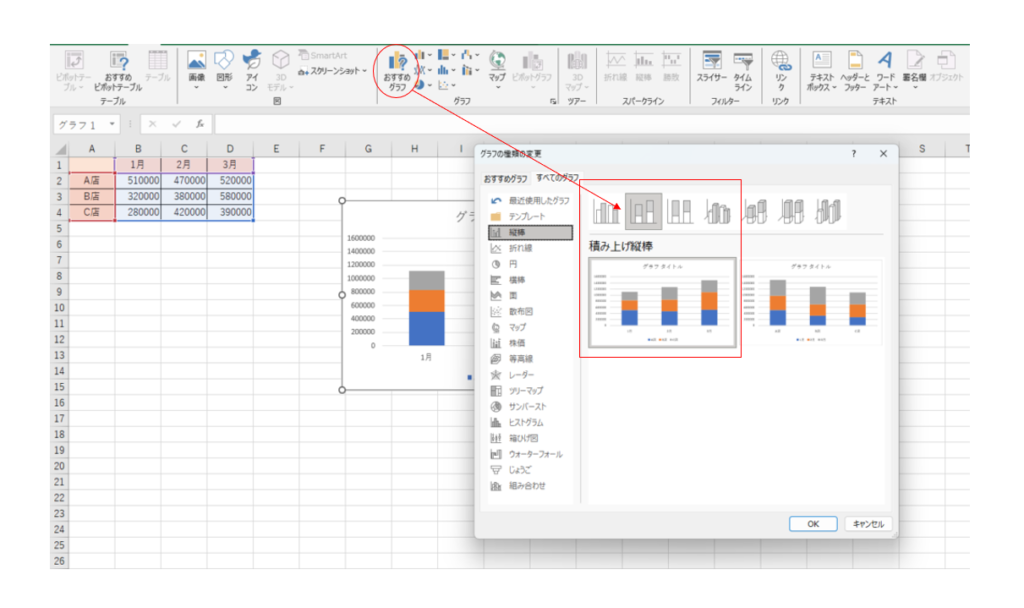
おすすめグラフから積み上げ縦棒を選択
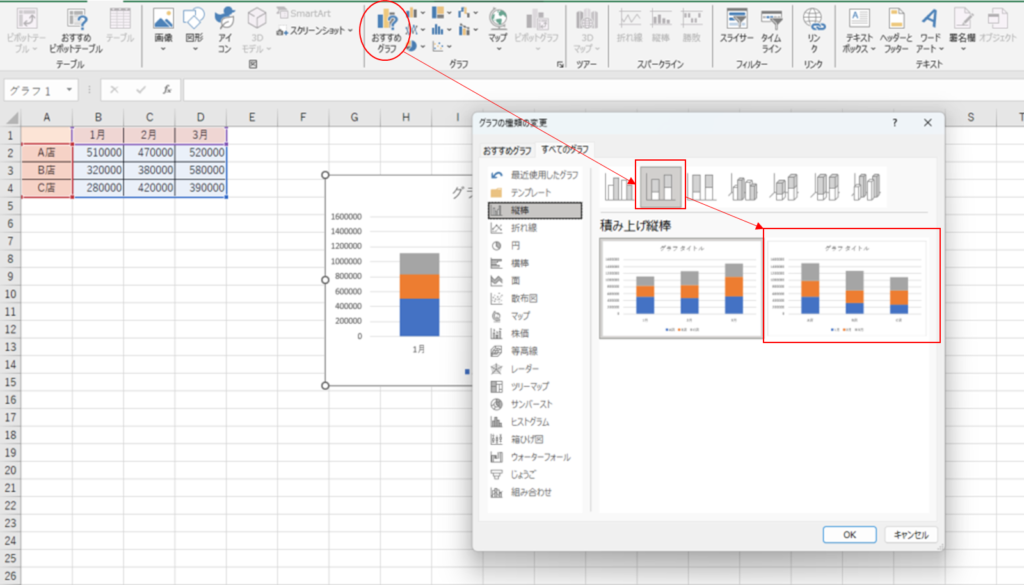
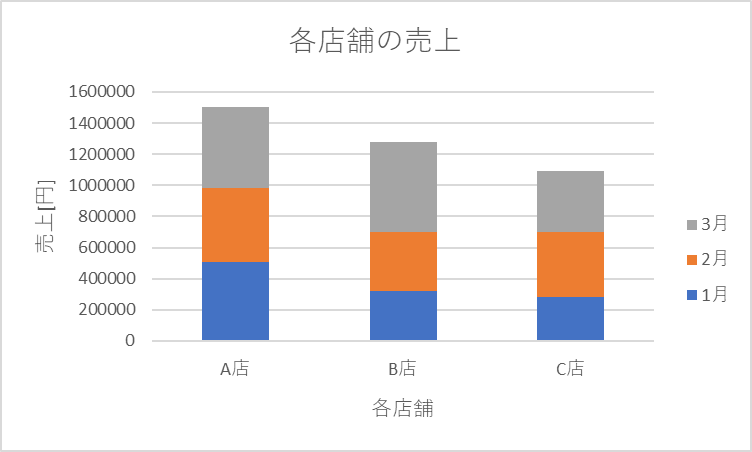
グラフにラベルとタイトルをつけて表示する
Yamu
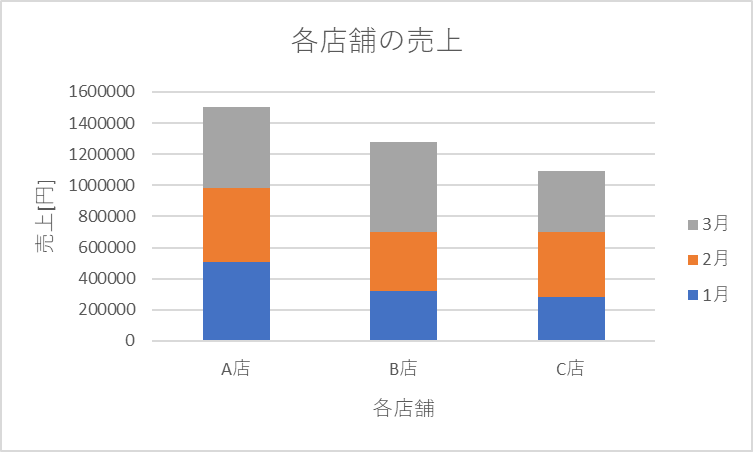
1~3月の売り上げを積み上げてみると
A店が最も好調であることがわかりました
積み上げグラフ作成後、データ追加は簡単にできる
このグラフに下記の
下記の4月5月の売上データを追加したいと考えています
| 各支店 | 4月 | 5月 |
| A店 | 60,0000 | 58,0000 |
| B店 | 54,0000 | 50,0000 |
| C店 | 65,0000 | 49,0000 |
1~3月のデータに4,5月のデータを追加します
| 1月 | 2月 | 3月 | 4月 | 5月 | |
| A店 | 51,0000 | 47,0000 | 52,0000 | 60,0000 | 58,0000 |
| B店 | 32,0000 | 38,0000 | 58,0000 | 54,0000 | 50,0000 |
| C店 | 28,0000 | 42,0000 | 39,0000 | 65,0000 | 49,0000 |
グラフの空白部分を左クリックします
青枠がデータの範囲です
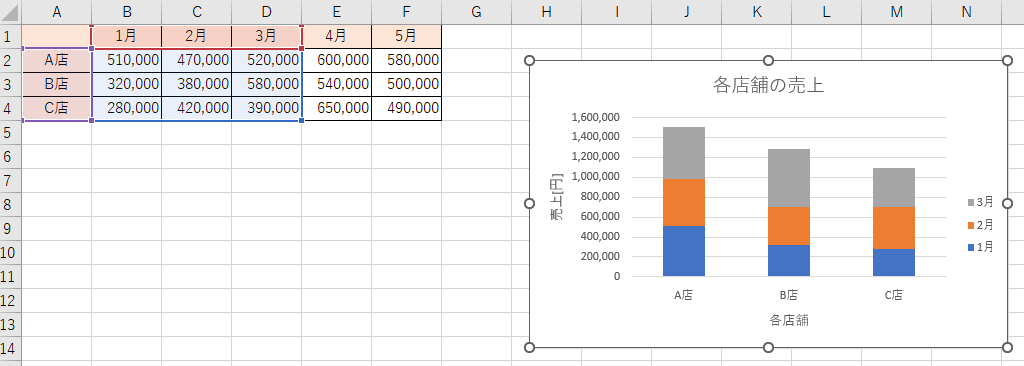
データの左端をクリックさせながら青枠の
範囲を広げていきます
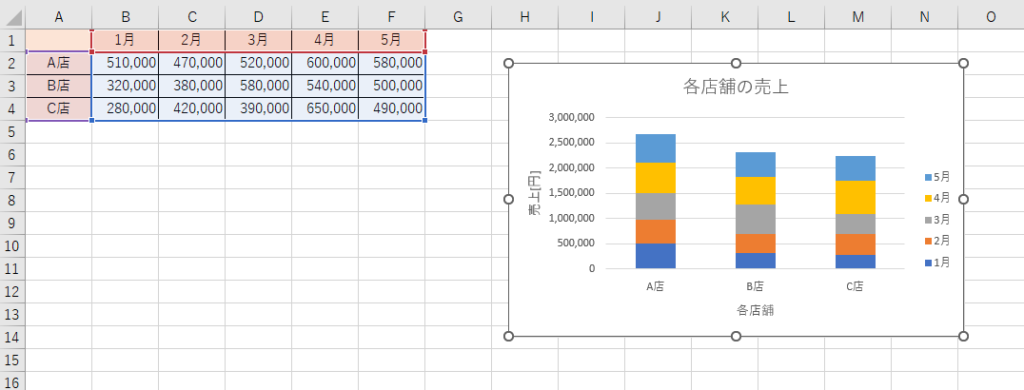
4月5月のデータを追加できました
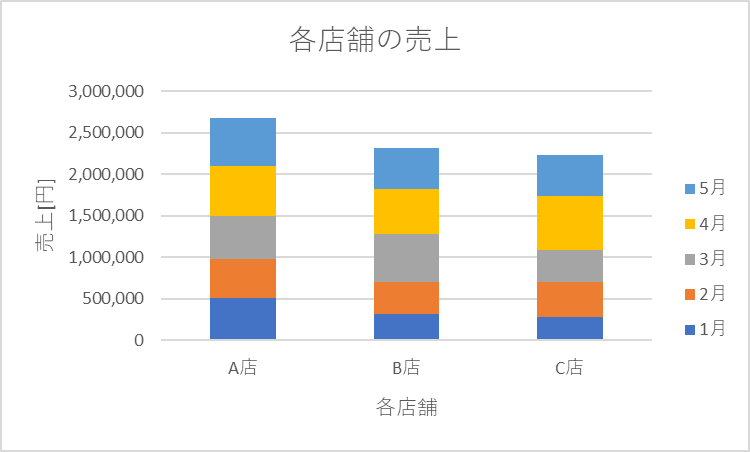
Yamu
1~5月の売上トータルトップは
A店といった事が分かりました
積み上げ棒グラフを集合棒グラフに変換
グラフを右クリックし
グラフの種類の変更を押す
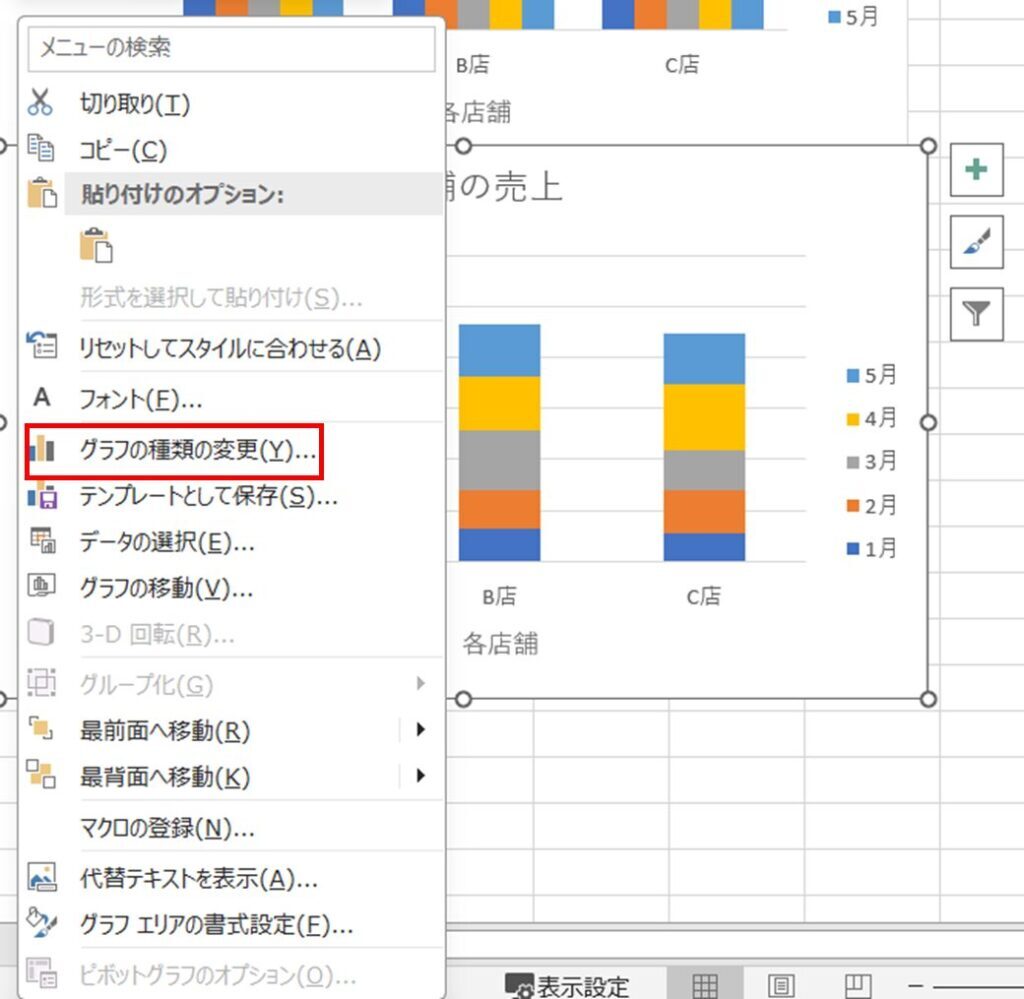
集合棒グラフを選択する
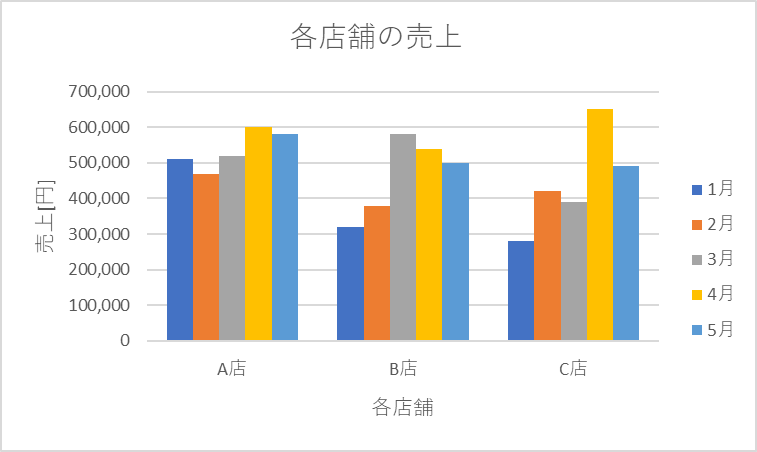
Yamu
C店の売り上げは多店舗と
比較して売れていませんが
4月だけ売上を上げている
ことが確認できました。